
Parts 2 and 3 showed how a single misconfiguration or over-exposed bridge method becomes desktop impact. Real applications expose dozens of channels. This part turns that insight into a repeatable methodology: map the surface, classify sinks, drive constrained probes from wordlists, and keep proofs inside lab clamps. The companion harness lives under electron-lab/fuzz/.
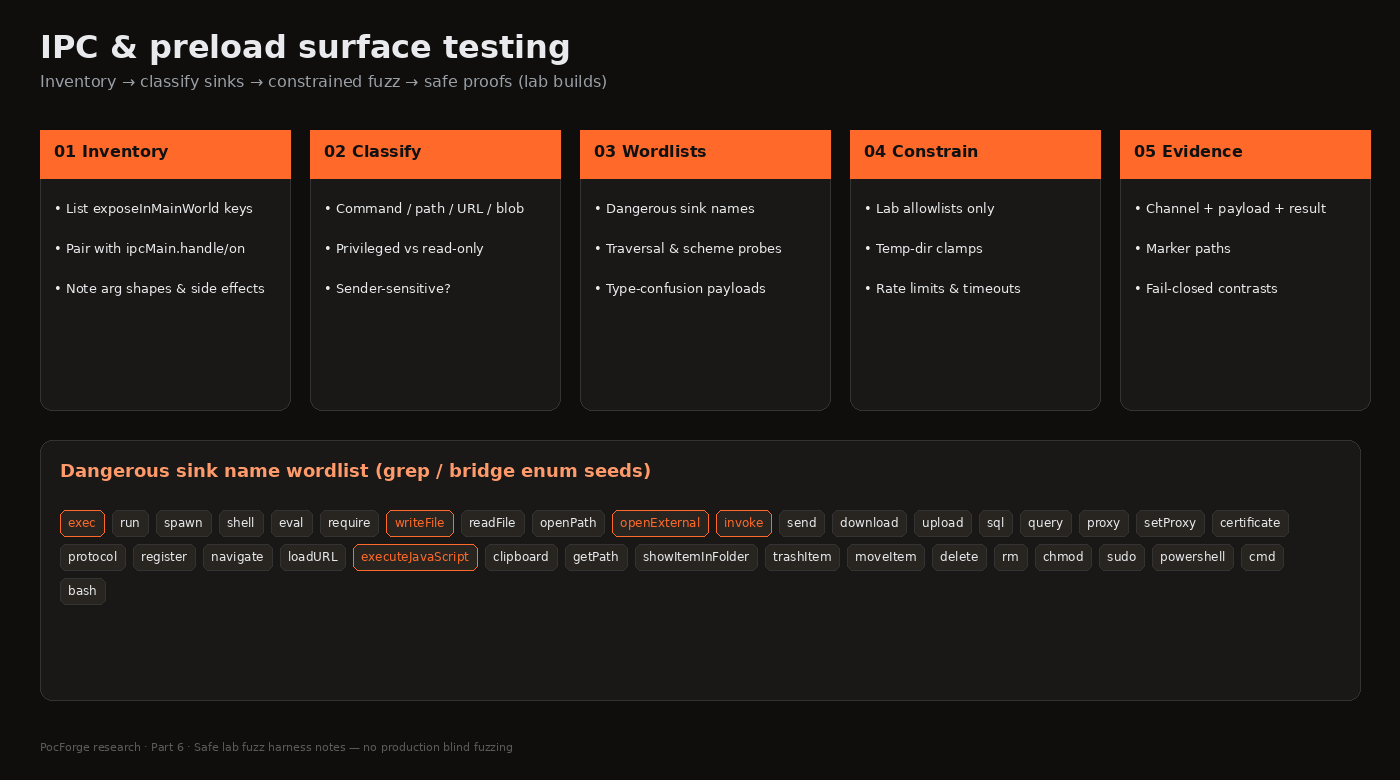
Keyboard: ← → · Respects reduced-motion (no autoplay).
1. Why systematic testing beats ad-hoc clicks
Manual UI buttons catch the obvious. Systematic testing catches the tenth invoke alias, the forgotten debug channel, and the handler that accepts an options object with an unexpected shell: true field. Community methodologies (DeepStrike, HackTricks, Electronegativity checks) all converge on the same idea: treat the bridge as an API catalogue, then test it like one.
Blind fuzzing of a customer’s production main process is usually the wrong tool—timeouts, dialogs and disk writes disrupt users. Prefer inventory-first probes on lab builds, unpackaged debug builds the customer supplies, or disposable VMs under written RoE.
2. Inventory recipe (preload + ipcMain)
- Extract ASAR or open the lab tree; record
package.jsonmain. - Grep
contextBridge.exposeInMainWorld,ipcRenderer.invoke,ipcRenderer.send,ipcMain.handle,ipcMain.on. - Build a spreadsheet: bridge method → channel → handler file:line → args → side effect → sender check?
- Mark anything that reaches
child_process,fs,shell,net,protocol,session, orexecuteJavaScriptas privileged.
# Teaching greps against an extracted app or the series lab
rg -n "exposeInMainWorld|ipcMain\.(handle|on)|ipcRenderer\.(invoke|send)" .
rg -n "execFile|exec\(|spawn\(|openExternal|writeFile|readFile|loadURL" .
3. Dangerous sink wordlists
The lab ships electron-lab/fuzz/dangerous-sinks.txt—seeds for greps and for guessing over-exposed bridge keys when source is messy. High-signal names include exec, runCommand, writeFile, openExternal, invoke, executeJavaScript, loadURL, setProxy and protocol. Pair with path-probes.txt for path-normalisation and scheme-allowlist probes aimed at path-like handlers.
# See electron-lab/fuzz/dangerous-sinks.txt in the lab folder
# Seeds cover process, filesystem, navigation and protocol-related API names.
# Keep the list in the lab tree — do not paste raw OS command names into tickets.
Do not treat the wordlist as an exploit kit. It is a coverage checklist: if a bridge method’s name matches, read the handler before sending anything.
4. Safe lab fuzz harness notes
Under electron-lab/fuzz/:
run-lab-fuzz.js --dry-run— prints planned cases (allow vs deny commands, path probes, marker names) without touching Electron.--apply-markers— writes sanitised markers under the OS temp lab directory only.- README documents principles: inventory first, classify sinks, constrain blast radius, never expand the command allowlist for “better demos.”
cd electron-lab
node fuzz/run-lab-fuzz.js --dry-run
node fuzz/run-lab-fuzz.js --apply-markers
npm run start:bridge   # then probe labApi with planned cases in DevTools
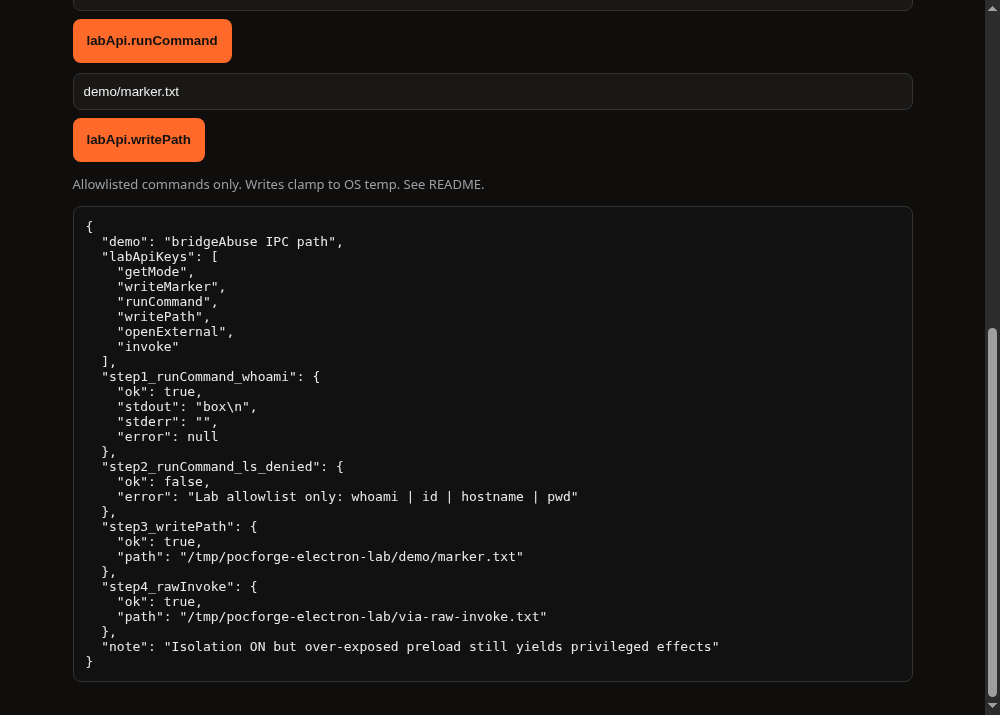
5. Find → exploit walkthrough (lab)
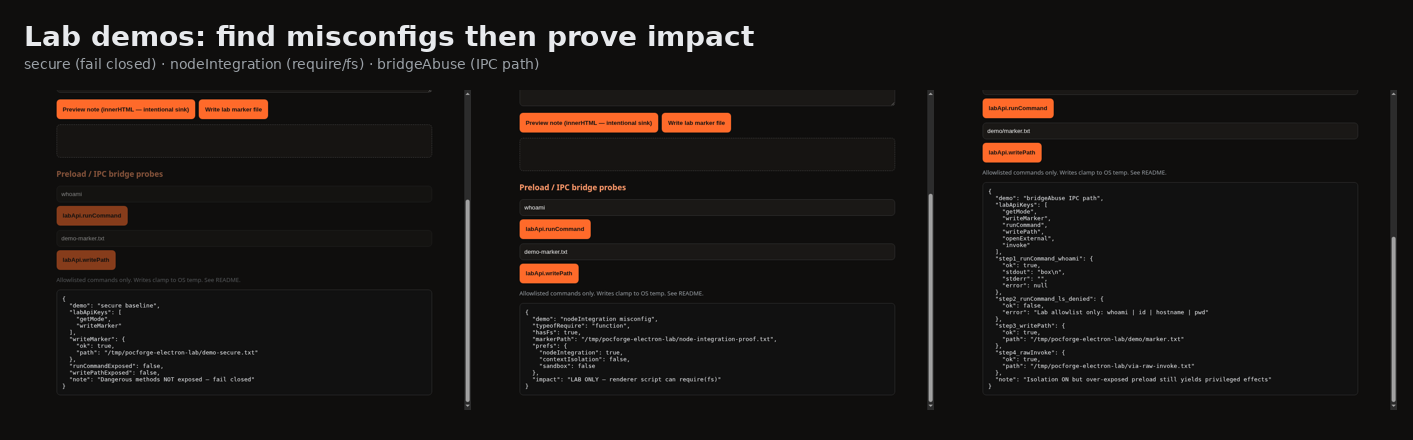
- Find prefs — open
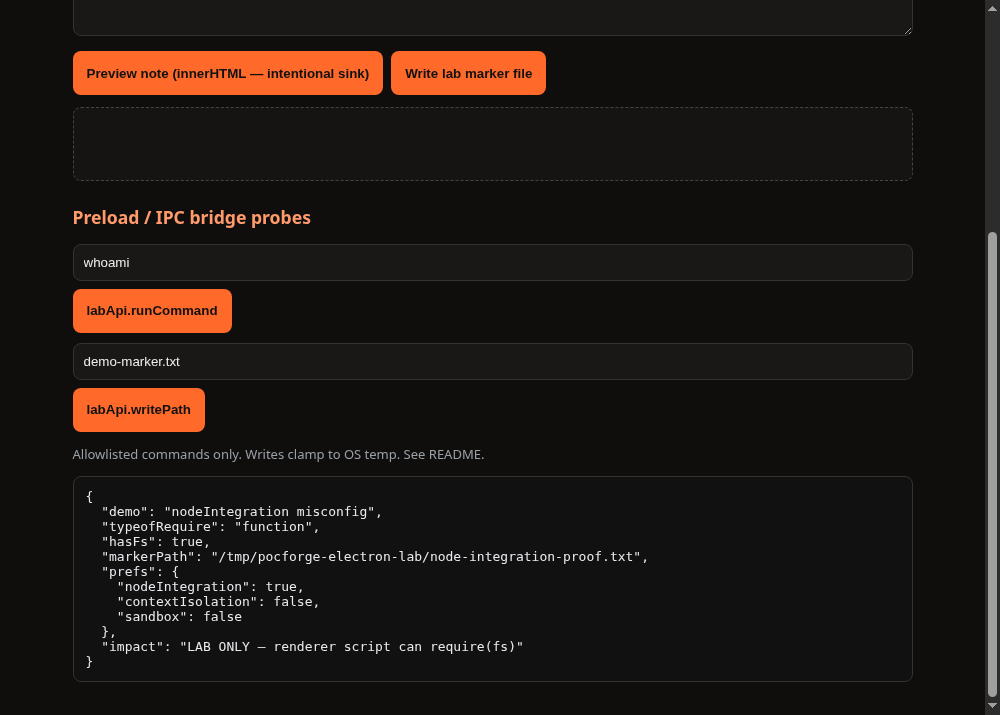
main.js, noteELECTRON_LAB_MODEbranches. Runnpm run start:nodeand confirm the mode banner. - Exploit nodeIntegration — in DevTools, evaluate
typeof requireand write a marker withrequire('fs')under the lab temp directory. - Find bridge surface —
npm run start:bridge, runObject.keys(window.labApi). - Exploit IPC —
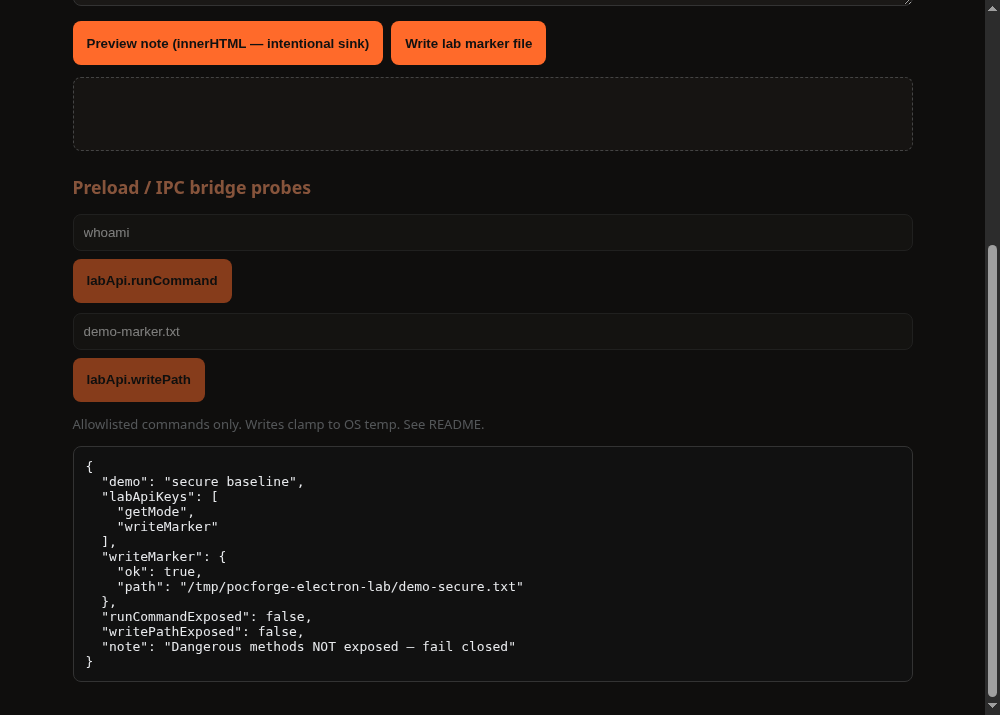
await labApi.runCommand('whoami'), then a denied command, thenwritePath, then rawinvoke. - Contrast —
npm run start:secureand show dangerous keys absent.
// LAB ONLY — DevTools in bridgeAbuse mode
Object.keys(window.labApi)
await window.labApi.runCommand('whoami')
await window.labApi.runCommand('ls') // expect deny
await window.labApi.writePath('fuzz/ipc-demo.txt', 'pocforge-lab-write\n')
await window.labApi.invoke('lab:write-marker', 'fuzz-invoke')
6. Payload classes that earn their keep
| Class | Examples (lab) | What you learn |
|---|---|---|
| Allowlisted command | whoami, id |
Handler reaches process-spawn path |
| Denied command | ls, command-substitution probes |
Allowlist fail-closed behaviour |
| Relative path | nested/a.txt |
Intended write root |
| Traversal / absolute | parent-directory segments, absolute paths outside the app root |
Normalisation gaps vs safety clamps |
| Raw channel | invoke('lab:…') |
Passthrough anti-pattern |
| Type confusion | arrays / numbers where strings expected | Schema absence |
On customer apps, replace lab channels with inventored names. Keep the same classes. Prefer markers and allowlisted binaries over GUI calculators in enterprise evidence packs.
7. Reporting systematic IPC work
One finding per privileged capability is clearer than a hundred payload rows. Example title: “Preload exposes runCommand IPC leading to allowlisted process execution.” Attach the inventory row, a representative success, a representative deny, and the secure-mode contrast when available. Link prefs from Part 2 when isolation is also wrong—severity compounds.
Electronegativity and similar static checkers complement this work; they do not replace reading handlers. Use them to seed the spreadsheet, then prove impact manually under RoE.
8. Limits and ethics
- Do not point the lab harness at production estates.
- Do not remove temp clamps or widen command allowlists to “prove RCE harder.”
- Do not invent CVE IDs when a custom bridge bug has none.
- Stop when RoE excludes update hijack, integrity bypass or host-wide DoS—document residual risk instead.
9. Channel guessing versus source-backed inventory
When ASAR is available, prefer source-backed inventories. When it is not—or when minification obscures names—testers sometimes probe guessed channel strings. Keep that activity on lab or explicitly authorised builds: random invoke storms against a live corporate desktop are a denial-of-service risk and a professionalism problem.
A practical compromise: extract strings from the binary/ASAR (strings, rg, unpacked renderer bundles), build a candidate channel list, then exercise only those candidates. The lab’s raw labApi.invoke passthrough exists specifically so analysts can practise that discipline safely—call known lab: channels, observe successes, then try a nonsense channel and record the rejection.
// LAB ONLY — channel discipline
await window.labApi.invoke('lab:get-mode')
await window.labApi.invoke('lab:does-not-exist') // expect error; note message
10. Light automation patterns (lab)
Once cases are classified, a short script can iterate payloads and write a JSON report under the temp lab directory—the harness’s --apply-markers mode is the minimal version. For richer runs inside bridgeAbuse, keep a DevTools snippet or a Spectron/Playwright-driven lab launcher that:
- Starts Electron with
ELECTRON_LAB_MODE=bridgeAbuse. - Waits for
labApi. - Iterates the planned case list with per-call timeouts.
- Writes
fuzz-report.jsonnext to markers. - Exits without opening external URLs beyond the lab allowlist.
Resist the urge to turn that runner into a general “Electron RCE fuzzer” published against the internet. Scope it to electron-lab/ paths and documented handlers. Customer work gets a fresh inventory, not a recycled payload file aimed at unknown channels.
11. Severity hints for IPC findings
| Pattern | Typical severity band | Notes |
|---|---|---|
| Raw invoke/send exposure | High–Critical | Depends on reachable handlers |
| Command string to exec | Critical | Even with partial allowlists |
| Path write with weak normalisation | High | Show clamp vs intended root |
| openExternal without scheme allowlist | High | Platform-dependent impact |
| Read-only info leak via IPC | Medium | Tokens/paths elevate it |
| Missing sender checks only | Medium | Higher if multi-frame content |
Always narrate the path. “IPC exists” is not a finding; “renderer-controlled string reaches execFile” is.
12. Part 6 mini-checklist
- □ Bridge + ipcMain inventory spreadsheet complete
- □ Privileged sinks classified
- □ Wordlist greps run on ASAR/lab
- □ Dry-run case list reviewed
- □ Lab proofs: success, deny, secure contrast
- □ Customer probes limited to inventored channels under RoE
- □ Report uses safe markers, not destructive demos
Together with Part 5’s engagement spine, this checklist keeps systematic IPC testing auditable—another analyst should be able to replay your cases from the spreadsheet and the lab notes alone.
13. After Part 6
Return to Part 5’s deliverables map and attach your IPC spreadsheet as an appendix. Link the deep-dive hub for the condensed privilege-boundary framing, and the desktop service page when scoping paid work. Keep the lab folder versioned beside engagement notes so demos stay reproducible when Electron majors move defaults again.
Systematic IPC testing is not glamorous—but it is how “we disabled nodeIntegration” stops being the end of the conversation and becomes the start of a proper bridge review.
FAQ
Is this the same as web API fuzzing?
Similar discipline, different blast radius. Desktop handlers can touch the OS user profile. Constrain first; broaden only with authorisation.
Should every channel be fuzzed?
Prioritise privileged sinks. Read-only telemetry handlers can wait. Time-box coverage in the RoE.
Where does this sit in the series?
After Part 3’s bridge abuse narrative and Part 5’s checklist. Use Part 6 when you need repeatable IPC coverage, not only two demo clicks.
Sources (public)
- Electron — Security tutorial (IPC sender validation; do not expose Electron APIs)
- DeepStrike — Electron penetration testing (IPC / preload sections)
- HackTricks — Electron Desktop Apps
- Doyensec — Electronegativity / Electron security research
- PocForge — Parts 1–5 of this series · Deep dive · Desktop VAPT
Lab demos and the fuzz harness are intentionally vulnerable training aids for authorised use only. PocForge does not claim CERT-In empanelment in this article. No fabricated CVE identifiers or statistics.